
Ozone Monitor Response Time: What T90 Means and Why It Matters
Ozone Monitor Response Time: What T90 Means and Why It Matters
When buyers compare ozone monitors, range and accuracy usually take center stage, while response time hides in a footnote of the datasheet. That footnote can decide whether your monitoring program works. If an ozone leak develops in a workshop, the reading on a slow instrument lags behind reality — and every second of delay is time your ventilation, alarms and staff are reacting to information that is already out of date. This guide explains what T90 response time means, where delays actually come from, and how to specify and verify response time for your application.
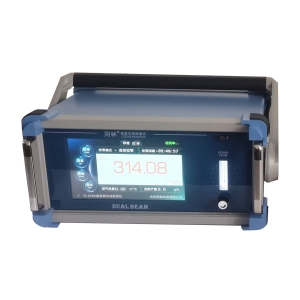
What T90 Actually Measures
Response time describes how quickly a monitor's output tracks a sudden change in ozone concentration. The industry convention is T90: the time it takes the reading to reach 90% of its final value after a step change. Some manufacturers also quote T50 or T63, which follow the same logic at lower thresholds. A T90 of 10 seconds means that ten seconds after ozone appears, the display shows 90% of the true value — the last 10% takes a little longer still.
Two very different mechanisms sit behind that number, and it pays to separate them:
- Sensor response — how fast the detection element itself reacts. A UV photometric engine responds optically almost immediately; electrochemical and semiconductor cells depend on ozone diffusing into the sensing structure, which is inherently slower.
- System response — everything between the sample point and the sensor: tubing length and diameter, flow rate, filters, and the volume of the flow cell. A fast sensor behind a long, narrow tube is a slow monitor.
Sensor Response vs. System Response
Datasheets usually specify T90 under controlled conditions — a stated flow rate, temperature and sample line length. If your installation differs, your real response time will differ too. When you evaluate an ozone monitor or analyzer, always check which conditions the T90 figure was measured under, and estimate your own system's delay before comparing instruments. Otherwise you may be comparing two numbers that describe two different setups.
Diffusion vs. Pumped Sampling: The Speed Difference
Ozone detectors reach the sample air in one of two ways, and the choice has a direct effect on response time.
Diffusion-type monitors have no pump; ambient air reaches the sensor by natural movement and convection. This keeps the instrument simple and quiet, but response depends on airflow around the sensor. In still corners, behind equipment, or inside an enclosure, a diffusion sensor can under-read and respond slowly. Placement then becomes part of the response-time equation — our earlier guide on measuring ozone generator performance discusses why sampling location changes what you actually measure.
Pumped (aspirated) monitors draw sample air through a line at a controlled flow rate. The transport delay is predictable, which is exactly what you want for alarm design. The trade-off is that every meter of tubing adds delay, and the pump, filters and fittings must be chemically compatible with ozone.
Estimating Sampling Line Delay
Transport delay is simple arithmetic: the tubing volume divided by the sample flow rate. A 10-meter run of 4 mm inner-diameter tubing holds roughly 0.13 liters of air. At a sample flow of 0.5 L/min, the air takes about 15 seconds to travel from the probe to the sensor — and that is before the sensor's own T90 is added. Practical ways to keep the delay small:
- Keep sample lines as short as the installation allows.
- Match tubing inner diameter to the monitor's design flow rate; a wider line moves more volume and can either help or hurt depending on flow.
- Avoid sharp bends, reducers and unnecessary junctions that create dead volumes.
- Use ozone-compatible materials (such as PTFE or suitable stainless grades) so ozone is not consumed by the line itself before it arrives.
Why Response Time Matters for Alarms and Compliance
For workplace safety monitoring, response time is part of your protection margin. Occupational exposure limits for ozone — for example, the 8-hour time-weighted average limit of 0.1 ppm listed by the Occupational Safety and Health Administration (OSHA) in the United States — are based on average exposure over time. A slow monitor does not just alarm late; during a short transient it also under-reports the peak your staff actually experienced. Alarm logic should therefore account for the total delay: sensor response plus transport delay plus any averaging or filtering built into the instrument's firmware.
In water treatment, the same physics applies in liquid form. A dissolved ozone monitor sampling from a loop or cell downstream of the injector sees transport delay from the water path as well as the sensor's own response. In an automatic control loop, that combined lag matters: if the controller reacts to a reading that reflects conditions from thirty seconds ago, it can overshoot the setpoint after dosing changes. Understanding the lag lets you set the control interval and alarm delays sensibly instead of fighting oscillation.
How to Verify Response Time Before Deployment
Response time is easy to test and belongs in your commissioning records:
- Establish a stable zero with the monitor sampling clean air, and note the baseline reading.
- Apply a step change — connect the sample line to a source of known ozone concentration, or move a portable instrument quickly from clean air into a generated ozone stream.
- Record the time to 90% of the final stable reading. Repeat at least once, because first tests can be affected by residual ozone in tubing.
- Test the whole chain, not just the sensor: trigger an alarm condition and measure the time from step change to relay activation and fan start. End-to-end alarm delay is the number your safety procedure actually depends on.
Document the conditions used — line length, flow rate, temperature — alongside the measured T90. If the figure drifts noticeably over successive maintenance cycles, it can be an early sign of a clogged filter, an aging pump, or sensor contamination.
What to Look For in a Datasheet
Before ordering, ask three questions about response time. First, under what conditions is T90 quoted — flow rate, line length, temperature? Second, does the specification describe the sensor alone or the complete sampling system? Third, how quickly does the instrument recover after a high spike, since ozone can saturate some sensing surfaces and slow the return to baseline? A monitor with a moderate T90 and honest, well-documented test conditions will serve you better on paper-specified speed that cannot be reproduced in your plant.
If you are unsure how response time, sampling design and alarm logic fit together for your facility, our engineers can review your layout before you order — start through our quotation and support page. Getting the delay budget right at design stage is far easier than discovering it during the first real alarm.
 Where to Install an Ozone Moni
 Ozone Monitor Bump Test vs Cal
 Why Is My Ozone Detector Readi
PPB-Level Ozone Measurement: C