
Ozone Sampling Lines: How Tubing Material and Length Affect Readings
Ozone Sampling Lines: How Tubing Material and Length Affect Your Readings
A UV ozone analyzer can hold its accuracy to a percent or two of the true concentration — but only for the gas that actually reaches its measurement cell. Between the sample point and the sensor sits the sampling line, and it is one of the most overlooked sources of error in ozone measurement. Ozone is a strong oxidizer that reacts with many common tubing materials; every reaction destroys ozone molecules that were supposed to be measured. A wrong hose choice or an unnecessarily long run can make a well-calibrated instrument report a value far below the real concentration at the sample point. This guide explains how tubing material, length, diameter and moisture affect ozone readings, and how to design and verify a sampling system you can trust.

Why the Sampling Line Is Part of the Measurement
Ozone is unstable. On any surface it touches, part of it decomposes back to oxygen, and the rate of that decomposition depends strongly on the material. Inside a sampling line, ozone molecules repeatedly collide with the tube wall, so the longer the contact time and the more reactive the wall, the more ozone is lost before measurement.
The practical consequence is easy to miss: the analyzer is working perfectly, yet the system reads low. If you then compensate by turning up an ozone generator or extending an exposure, you are tuning your process against an artifact of the plumbing, not against real conditions. Treat the sampling line as part of the instrument, and specify it with the same care you apply to the analyzer itself.
Tubing Materials: What Works and What Quietly Consumes Ozone
Material choice dominates sampling losses. Broadly, the smoother and more inert the inner surface, the less ozone it destroys.
Recommended materials
- PTFE (polytetrafluoroethylene) — highly inert and the standard choice for ozone sample lines. FEP and PFA, both members of the fluoropolymer family, behave similarly and are easier to work with in tight bends.
- 316 stainless steel — acceptable once its surface has been conditioned by ozone exposure. A freshly installed stainless line can absorb a noticeable amount of ozone until the inner surface stabilizes, so expect a break-in period and re-verify afterwards.
- Glass — chemically inert and used in laboratory manifolds, though impractical for routine industrial routing.
Materials to avoid
- Silicone, natural rubber and PVC — these elastomer-rich materials react with ozone quickly and can consume a large fraction of the sample. A reading taken through a silicone line tells you more about the tubing than about your process.
- Nylon and polyurethane — better than rubber but still reactive enough to bias readings, especially on long runs or at low flow rates.
- Contaminated lines — oils from handling, dust, and corrosion all add reactive surface. Even a PTFE line performs poorly if its bore is dirty.
Fittings deserve the same attention. Brass and ordinary rubber-sealed fittings introduce reactive surfaces and permeable seals right where turbulence maximizes wall contact. Use PTFE or stainless fittings with compatible seals, and keep the number of joints to a minimum.
Length, Diameter and Residence Time
Even with inert tubing, loss is a function of time and surface area. Three dimensions matter:
- Length — every additional meter adds wall contact time and raises both measurement loss and transport delay. Keep the run as short as the installation allows.
- Inner diameter — a narrow tube has a high wall-surface-to-gas-volume ratio, so ozone contacts the wall more often per unit of gas. Larger-bore tubing reduces that ratio, at the cost of longer flush time.
- Flow rate — higher flow shortens residence time, which reduces both the decomposition loss and the transport delay. Match the flow to the analyzer's requirement and don't starve it with long, thin tubing.
Sampling lines also add response delay: the volume of the tube must be flushed before the sensor sees a change at the sample point. At low flow rates this delay can reach into minutes, which matters for leak detection and alarm design. We cover the underlying concept in our article on ozone monitor response time and T90, and the same logic applies to how quickly a fixed installation reacts — see our guide on where to mount ozone detectors for the other half of that equation.
Moisture and Condensation: The Silent Reading Killer
Ozone is highly soluble in water, so a droplet of condensate anywhere in the sampling path can pull the reading down sharply. Sampling hot, humid gas through a cool line — for example, off the outlet of an ozone generator feeding a humid air stream — invites condensation on the tube wall.
Practical countermeasures include routing lines through warm spaces rather than cold ones, keeping runs short so the sample doesn't cool, sloping lines so any condensate drains away from the analyzer, and never letting the sample dew point approach the line temperature. If liquid ever reaches the sensor, stop and dry the system completely before trusting the readings again. For measuring ozone in water rather than in gas, the approach is entirely different — that is the domain of a dissolved ozone monitor, which measures the liquid stream directly instead of sampling headspace gas.
A Simple Procedure to Verify Your Sampling System
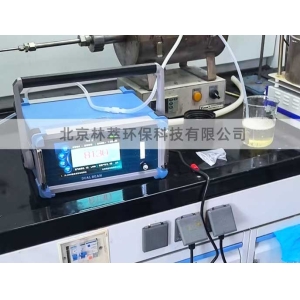
You do not need a laboratory to check whether your line is distorting readings. A portable UV ozone analyzer and half an hour are enough:
- Establish the baseline. Place the portable analyzer directly at the sample point, as close to the source as possible, and record the steady reading.
- Measure through the line. Connect the same analyzer (or the fixed monitor under test) to the permanent sampling line and record the steady reading at the same flow rate.
- Compare. A small difference is normal; a large or drifting gap points to reactive material, contamination, or condensation in the line.
- Check the delay. Apply a step change — move the probe into fresh ozone-containing air — and time how long the reading takes to settle. If the delay exceeds what your alarm logic can tolerate, shorten the line or raise the flow.
Repeat this check after any plumbing change, after replacing tubing, and as part of periodic verification. If your readings need a documented, traceable basis for compliance or customer reporting, our team can help — see our quotation and support page for calibration references and application reviews.
Sampling Line Design Checklist
- Use PTFE, FEP or PFA tubing; avoid silicone, rubber, PVC and nylon.
- Keep the line as short and straight as the installation allows.
- Size the bore and flow so the analyzer gets its required flow with margin.
- Choose inert fittings and seals; minimize joints and dead volume.
- Protect the sample from cooling and condensation along the route.
- Install particulate filtration at the sample point, using a filter body that is itself ozone-compatible.
- Verify the line with a step-change test after installation and after every modification.
Conclusion: Measure the Process, Not the Plumbing
Most "my ozone monitor reads low" problems are not instrument problems at all — they are sampling problems. An inert, short, well-flowed line preserves both the accuracy of the reading and the speed of the response, while a reactive or convoluted line quietly corrupts both. Design the sampling path deliberately, verify it with a simple step test, and your ozone readings will describe your process instead of your tubing. For help selecting or configuring a monitoring setup for your application, browse our gas ozone analyzer range or contact us through the support page.
 Where to Install an Ozone Moni
 Ozone Monitor Bump Test vs Cal
 Why Is My Ozone Detector Readi
PPB-Level Ozone Measurement: C